Three blow dry bar marketing ideas give clients a clear reason to book: showcase finished styles, promote quieter appointment slots, and build referral offers around repeat visits. Start with your booking calendar.
Choose one underfilled service window, then create a campaign that sends clients directly to those available appointments.
Your strongest marketing material shows what clients can expect: polished finishes, clear service descriptions, and transparent booking options.
This guide explains how to turn stylist portfolios, local partnerships, and follow-up messages into focused campaigns. Track completed appointments against each promotion to distinguish attention from activity that fills your chairs.
Calculate Your Per-Chair Marketing Budget
Most blow dry bar owners set marketing spend as a flat percentage of revenue. That ignores capacity. A four-chair bar and a ten-chair bar operating at the same revenue need different strategies. Work out your number per chair instead.
- Count your styling chairs. Include only chairs actively used for blowouts, not waiting or colour stations. A typical bar runs 3–6 chairs.
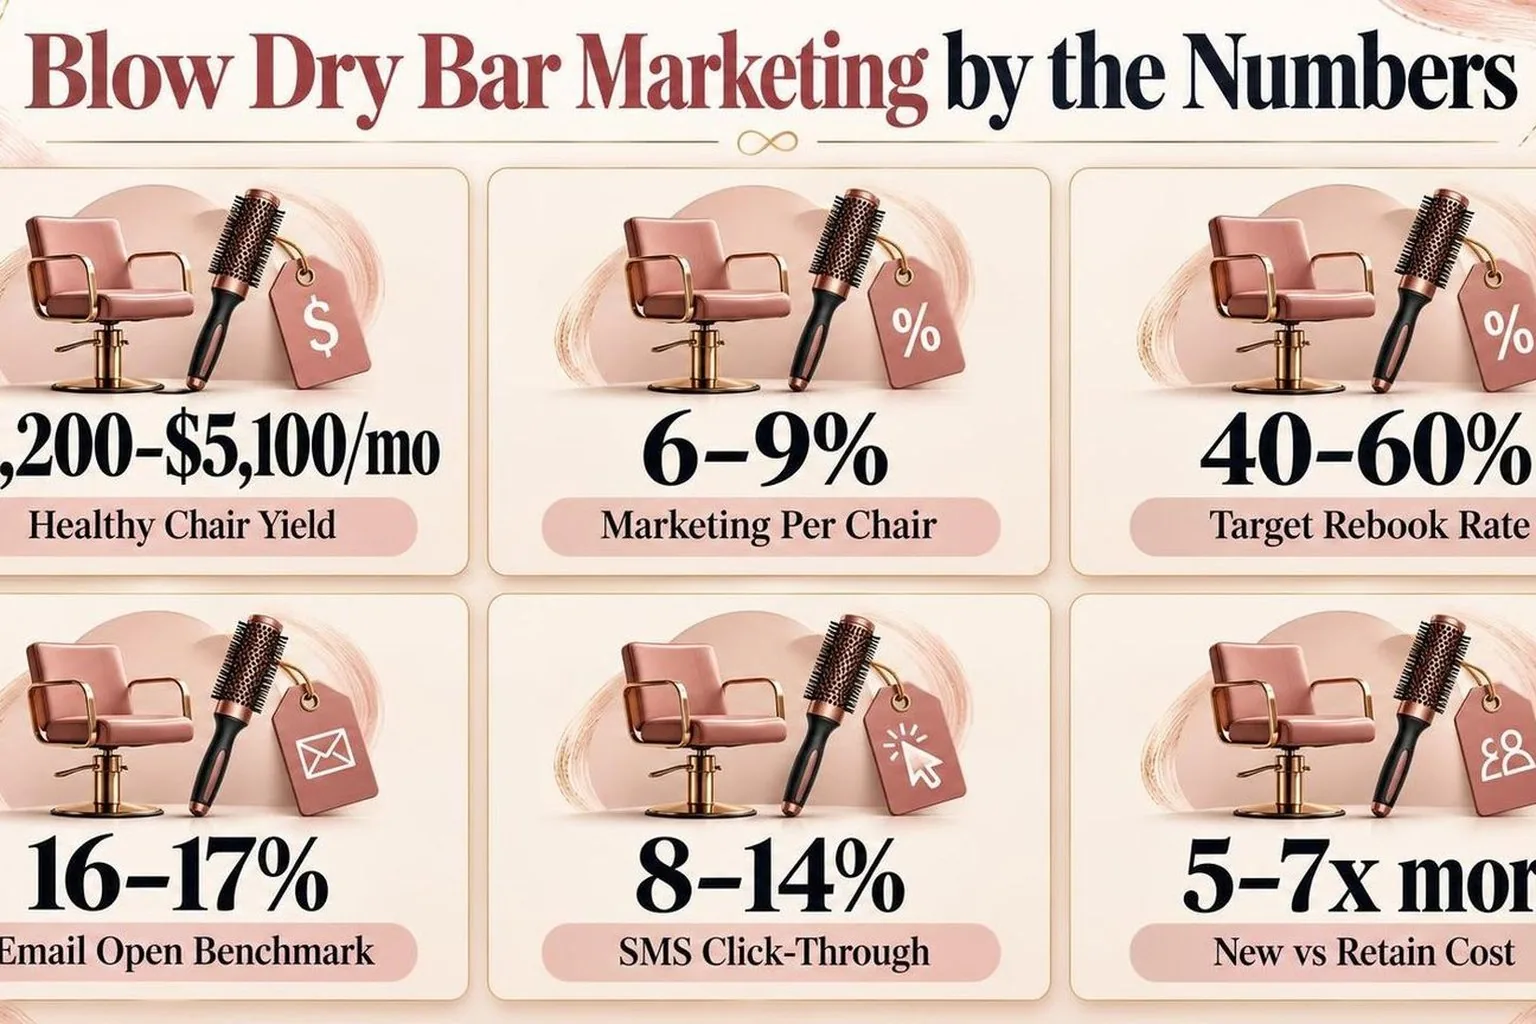
- Pull your monthly gross revenue. Use the average of your last three trading months. Divide that figure by your chair count. A healthy single-chair monthly yield sits between £2,800 and £4,500 (or $3,200–$5,100).
- Apply the 6–9% rule per chair. Multiply each chair’s monthly yield by 0.06 (lean) or 0.09 (growth mode). A chair yielding $4,000 gives you $240–$360 in marketing budget allocated to filling that specific chair.
- Flag underperforming chairs. Any chair yielding below $2,400/month gets the 9% rate plus a reactivation campaign — the ideas later in this article apply here first.
- Reassess every 90 days. Shift budget from chairs consistently above 80% occupancy toward chairs sitting below 60%. Track bookings per chair, not just total footfall.
Write your per-chair figure down now. Every marketing idea that follows should be weighed against that specific number, not a vague annual total.
Reading the Numbers Properly
Effective blow dry bar marketing starts with understanding exactly which metrics matter and what benchmarks to aim for. Vanity numbers — raw follower counts, total page views — mislead.
Focus on conversion-oriented data that ties directly to bookings, retention, and per-client revenue.
The Metrics That Actually Drive Revenue
Track these five figures weekly at minimum. Each one connects marketing spend to salon income in a measurable, actionable way.
- Cost per acquisition (CPA): Total marketing spend divided by new clients booked. A CPA above your average ticket price signals unsustainable spending.
- Rebooking rate: Percentage of clients who schedule a return visit within 6 weeks. Target 40–60% for a healthy blow dry bar.
- Average ticket value: Revenue per visit including add-ons such as treatments, braids, or styling upgrades.
- Email open rate: Industry average for beauty and wellness sits around 16–17% according to Mailchimp’s benchmark data. Below 14% means your subject lines or send times need work.
- Google Business Profile actions: Clicks to call, direction requests, and website visits from your listing — the single highest-intent local discovery channel.
Channel-by-Channel Benchmark Comparison
Not every platform delivers equal return. The table below compares typical performance ranges for blow dry bars across common marketing channels.
| Channel | Avg. Click-Through Rate | Typical CPA Range | Best Use |
| Instagram (organic) | 0.5–1.0% | Difficult to isolate | Brand awareness, portfolio display |
| Instagram (paid) | 0.8–1.5% | $15–$35 | Local reach, event promotion |
| Google Search Ads | 3–6% | $10–$25 | High-intent “blow dry bar near me” queries |
| Email campaigns | 1.5–3.0% | Under $5 | Rebooking, loyalty, slow-day fills |
| SMS/text campaigns | 8–14% | Under $3 | Same-day availability, flash offers |
| Google Business Profile | N/A (action-based) | Free | Local discovery, reviews, map pack visibility |
SMS consistently outperforms email on click-through rate, but list sizes are typically 3–5 times smaller. Use both channels together rather than choosing one.
Reading Retention vs. Acquisition
Acquiring a new blow dry client costs 5–7 times more than retaining an existing one. This ratio, widely cited in service-industry research, makes rebooking the most profitable metric to optimise.
Split your marketing budget roughly 60/40 in favour of retention once your client base reaches a sustainable level — generally 150 or more unique clients per month.
Retention tactics include automated rebooking reminders sent at 4 weeks, a loyalty program that rewards every fifth visit, and personalised SMS on a client’s preferred service day.
When to Worry
Red flags that your marketing numbers need immediate attention:
- CPA exceeding 50% of your average ticket value for 3 consecutive weeks
- Rebooking rate dropping below 30%
- Google Business Profile “direction requests” declining month-over-month by more than 15%
- Email list unsubscribe rate climbing above 0.5% per send
- Paid ad frequency rising above 3.0, meaning the same audience sees your ad too often
Building a Weekly Dashboard
Use a single-page spreadsheet or your booking software’s built-in reports. Record CPA, rebooking rate, average ticket, and channel-specific click-through every Monday morning.
Review trends over rolling 4-week windows rather than reacting to single-week spikes. Marketing data for a single location with 80–120 weekly appointments needs at least 4 weeks to show a reliable pattern.
Pair this dashboard with a simple traffic log at reception: ask every new client how they found you. Digital data and front-desk intel together give the full picture no analytics platform provides alone.

The Variables That Matter
Three variables separate blow dry bars that fill chairs from those that stall: client acquisition cost, rebooking rate, and average ticket value. Every marketing decision should move at least one of these numbers in a measurable direction.
Client Acquisition Cost (CAC)
CAC is total marketing spend divided by new clients gained in the same period. A salon spending $2,000 on Instagram ads that brings in 40 new clients has a CAC of $50.
That $50 figure only makes sense if those clients return. A single-visit client at a $45 blowout is a net loss after ad spend. A client who rebooks 6 times generates roughly $270 in revenue from the same acquisition dollar.
| Channel | Typical CAC Range | Rebooking Likelihood |
| Instagram/Facebook ads | $35–$75 | Moderate |
| Google Search ads | $25–$60 | Higher (intent-driven) |
| Referral program | $10–$30 | Highest |
| Walk-in/signage | Near zero | Variable |
| Influencer partnership | $40–$100+ | Low–moderate |
Referral programs consistently deliver the lowest CAC because the recommending client pre-qualifies the new one. A referred customer already trusts the service before walking in.
Rebooking Rate
Rebooking rate is the percentage of first-time clients who return within 90 days. Industry benchmarks for salons sit around 30–40 percent. High-performing blow dry bars push above 60 percent.
The gap between 35 percent and 60 percent rebooking is not about better blowouts. It is almost entirely a marketing and systems problem. Automated rebooking prompts, loyalty cards, and timed follow-up texts drive the difference.
- 24-hour follow-up text: Send a thank-you message with a direct rebooking link within 24 hours of the appointment.
- 14-day reminder: Prompt clients whose blowout cycle averages two weeks.
- Loyalty program: A simple “book 5, get 1 free” card increases visit frequency by encouraging commitment to a single bar.
- Membership model: Offering 2 or 4 blowouts per month at a reduced per-visit rate locks in recurring revenue and raises lifetime value.
Track rebooking by channel. If Google ads bring clients who never return but referrals bring clients who rebook 3 times on average, reallocate spend accordingly.
Average Ticket Value
A standard blowout at most bars falls between $35 and $55 depending on market. The marketing lever here is not raising the base price — it is increasing what each client spends per visit through add-ons and upgrades.
| Add-On Service | Typical Price | Attach Rate Target |
| Deep conditioning treatment | $15–$25 | 20–30% |
| Braids or updo upgrade | $15–$35 | 10–15% |
| Scalp massage add-on | $10–$15 | 15–25% |
| Retail product (finishing spray, dry shampoo) | $12–$32 | 15–20% |
If your average ticket is $42 and you attach a $20 treatment to 25 percent of visits, your effective average rises to $47. Across 800 monthly appointments, that is $4,000 in added monthly revenue.
Menu boards at the styling station outperform verbal upsells. Clients process visual prompts while seated, and a printed add-on menu with clear pricing removes the awkwardness of a stylist pitching mid-blowout.
Tying the Three Together
These variables compound. Lowering CAC from $50 to $25, raising rebooking from 35 to 55 percent, and lifting average ticket by $5 can double the return on every marketing pound or dollar spent.
Measure all three monthly. Post the numbers where your team can see them. Marketing that cannot be traced to one of these three metrics is spending without strategy.
Judging It in Practice
Judging blow dry bar marketing requires tracking three metrics weekly: new client acquisition cost, rebooking rate, and average ticket value. Without these baselines, every campaign is guesswork.
Effective operators benchmark against industry averages and adjust spend within 14-day cycles.
Start by isolating your client acquisition cost (CAC). Divide total monthly marketing spend by the number of first-time clients that spend generated. Compare your result against the benchmarks below.
| Channel | Typical CAC Range | Measurement Window |
| Instagram paid ads (local targeting, 10-mile radius) | $18–$45 per new client | 7–14 days |
| Google Search ads (branded + “blow dry near me”) | $22–$55 per new client | 7–21 days |
| Referral programme (e.g., give $15 / get $15) | $12–$20 per new client | 30 days |
| Local influencer partnership (micro, 5K–25K followers) | $8–$30 per new client | 14–30 days |
| Walk-in signage and A-board | $2–$6 per new client | Ongoing |
If your CAC exceeds 30% of your average first-visit ticket, the channel is underperforming. Pause it, adjust creative or targeting, then re-test for another 14-day cycle before cutting entirely.
Rebooking Rate as the Core KPI
Industry benchmarks for salon rebooking sit between 30% and 40%. Blow dry bars targeting 60-minute services should aim for a minimum 45% rebooking rate within 30 days of a first visit.
Track this inside your POS or booking software. Most platforms — Boulevard, Vagaro, Fresha — generate rebooking reports automatically. Pull them weekly, not monthly, to catch downward trends before they compound.
- Below 30% rebooking: service or experience problem, not a marketing problem — survey departing clients
- 30%–44% rebooking: test a post-visit SMS sequence at 48 hours, 7 days, and 21 days with a time-limited rebooking incentive
- 45%+ rebooking: marketing is converting and the service holds — shift budget toward acquisition channels
Average Ticket Value
Upselling add-ons (treatments, braids, styling upgrades) directly affects whether a marketing campaign breaks even. Track average ticket weekly alongside CAC.
| Metric | Warning Threshold | Target Threshold |
| Average ticket value | Below $45 | $55–$75 |
| Add-on attachment rate | Below 15% | 25%–35% |
| Retail product per-client spend | Below $4 | $8–$12 |
If your average ticket sits below $45, promotional discounting may be eroding margins faster than new clients replace them. Audit which offers are active and sunset any deeper than 20% off.
The 14-Day Test Cycle
Run every new campaign — whether a social ad, partnership, or in-store promotion — for exactly 14 days before evaluating. Shorter windows produce unreliable data; longer ones waste budget on underperformers.
- Day 1: launch with defined spend cap (recommended: $150–$300 per channel test)
- Day 7: pull interim CAC and click-through rate — adjust creative if CTR falls below 1.8%
- Day 14: calculate final CAC, compare to your threshold, decide to scale, iterate, or kill
Document every test in a shared spreadsheet with columns for channel, spend, new clients generated, CAC, and rebooking rate at 30 days. This builds an institutional record that prevents repeating failed tactics.
Operators who follow this cycle consistently report narrowing their active marketing to 2–3 channels within 90 days, concentrating budget where returns are measurable and repeatable.
Set Against the Other Options
Blow dry bars compete against full-service salons, at-home styling tools, and mobile stylists for the same discretionary spend. Positioning requires showing clear advantages in time, price-per-visit, and finish quality.
Every marketing message should sharpen that contrast rather than ignore it.
Competitive Positioning by Channel
| Channel | Avg. Time per Visit | Typical Price Range | Finish Longevity | Booking Friction |
| Blow dry bar | 35–45 min | Varies by market | 3–5 days with proper prep | Walk-in or same-day app booking |
| Full-service salon blowout | 50–75 min | Varies by market | 2–4 days | Often 48-hr+ advance booking |
| At-home consumer dryer | 20–40 min | One-time tool purchase | 1–2 days typical | None |
| Mobile stylist | 45–60 min | Varies; travel surcharge common | 3–4 days | 24–72 hr advance booking |
Use this comparison directly in marketing collateral. A side-by-side table on your booking page reduces decision fatigue and frames your service as the fastest professional option.
Time as the Core Differentiator
The 35–45 minute service window is your sharpest weapon. Full-service salons bundle consultations, shampoo protocols, and upsell conversations that stretch appointments beyond an hour. Market the blowout as a contained, predictable time block.
Feature the average appointment length on Google Business profiles, Instagram bios, and printed signage. Clients searching “quick blowout near me” convert at higher rates when they see a specific number rather than vague promises.
Finish Quality vs. At-Home Tools
Consumer dryers typically output 1,800–1,875 watts. Professional salon dryers run 1,875–2,200 watts with concentrator nozzles that narrow airflow to roughly 2–3 cm openings.
That wattage gap translates directly to smoother cuticle closure and longer-lasting volume.
Photograph the difference. Before-and-after content comparing a DIY blowout with a professional finish performs well on visual platforms. Use consistent lighting: 5,000K daylight, same angle, same client.
Post these comparisons as carousel posts. According to publicly reported platform data, Instagram carousels generate higher average engagement rates than single-image posts across most account sizes.
Membership vs. Per-Visit Pricing
- Membership models lock in recurring revenue and reduce client acquisition cost over time
- Offer 2–4 blowouts per month at a bundled rate to shift price perception away from per-visit competitors
- Track redemption rates monthly — aim for 70–80% utilization to balance revenue retention with seat availability
- Display membership savings as a percentage on booking pages, not just raw currency figures
Memberships also generate useful data. Track visit frequency, preferred styles, and booking windows to refine staffing and inventory decisions.
Positioning Against Mobile Stylists
Mobile stylists charge travel surcharges and require advance booking. Counter this by emphasizing walk-in availability and same-day online scheduling.
If your bar seats 6+ chairs, promote the capacity advantage: group bookings for bridal parties, corporate events, or friend groups.
Run targeted ads within a 3–5 mile radius of your location. Geo-fenced campaigns on Meta platforms let you serve ads only to users physically near your bar, reducing wasted spend on audiences outside your service area.
Review Strategy as a Competitive Lever
Google Business profiles with 40+ reviews and an average rating above 4.5 stars tend to rank higher in local map pack results. Ask every client for a review within 2 hours of checkout, when satisfaction is freshest.
Provide a direct review link via SMS immediately after payment. Reducing the number of taps between request and submission increases completion rates significantly compared to email-based requests sent the following day.
- Set a team target: 8–12 new Google reviews per month per location
- Respond to every review — positive or negative — within 24 hours
- Mention specific services in responses to improve keyword relevance in local search
Competitive positioning is not a one-time exercise. Revisit your comparison messaging quarterly, update pricing references, and refresh visual proof. The bar that documents its edge most clearly wins the booking.
Frequently Asked Questions
What social media content format drives the most bookings for blow dry bars?
Short-form video — specifically before-and-after Reels under 15 seconds — consistently outperforms static posts in engagement for beauty businesses.
Film the transformation from wet hair to finished style in one continuous camera angle. Add a clear call-to-action with an online booking link in the caption.
How can a blow dry bar build a reliable referral program?
Offer a two-sided incentive: the referrer and the new client each receive a defined discount or complimentary add-on service. Track referrals through unique codes tied to your POS system.
Programs structured this way typically convert better than one-sided rewards because both parties feel the value.
What local partnerships generate measurable foot traffic for blow dry bars?
Cross-promote with businesses sharing your demographic but not your service category — boutiques, fitness studios, wedding planners, photographers.
Place physical vouchers at partner locations with a unique QR code so you can attribute every booking to its source and measure actual return.
How often should a blow dry bar send email marketing campaigns?
One to two emails per week is the effective range. Segment your list into at least three groups: first-time visitors, regulars booking monthly or more, and lapsed clients past 90 days. Each segment should receive different messaging.
Over-mailing unsegmented lists increases unsubscribe rates sharply.
Is it worth investing in Google Business Profile optimization over paid ads?
Optimise your Google Business Profile first. For location-dependent services like blow dry bars, a complete profile with 20-plus photos, weekly Google Posts, and consistent review responses directly influences local pack rankings.
Paid search ads complement this but should not replace a fully built organic listing.
Related Reading
- What it costs to open a blow dry bar
- EPLI for salons: when it starts to matter
- When a salon needs an alcohol licence
- Chair renters and insurance: who covers what
- Employee or contractor: how salons get this wrong
- What a booth renter actually takes home
- How booth rental works, and who it suits
- The licences a blow dry bar needs, and who issues them
- The types of salon insurance, and what each covers
- The complete guide to the blow dry bar business